
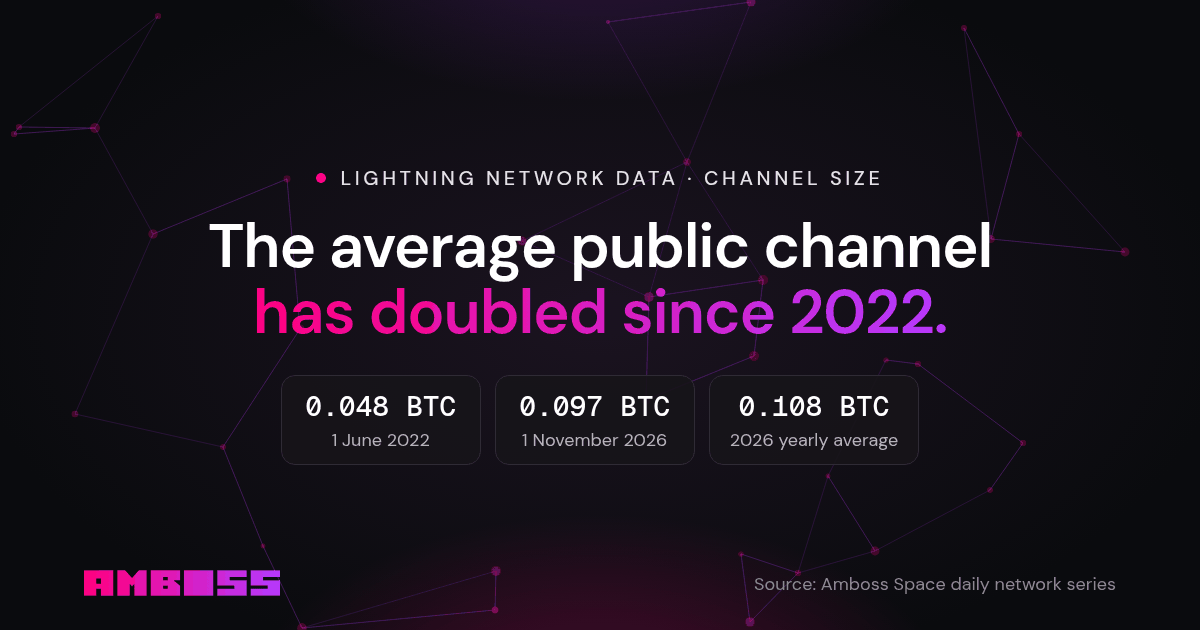
On 1 June 2022 the average public Lightning channel held 0.048 BTC. On 1 November 2026 it held 0.097 BTC, about twice as much. Measured as an average over each year, channel size has risen every year since our daily series began.
This post sets out the numbers, explains why channel size matters to anyone who depends on Lightning payments, and states what the data does not show.
The yearly picture
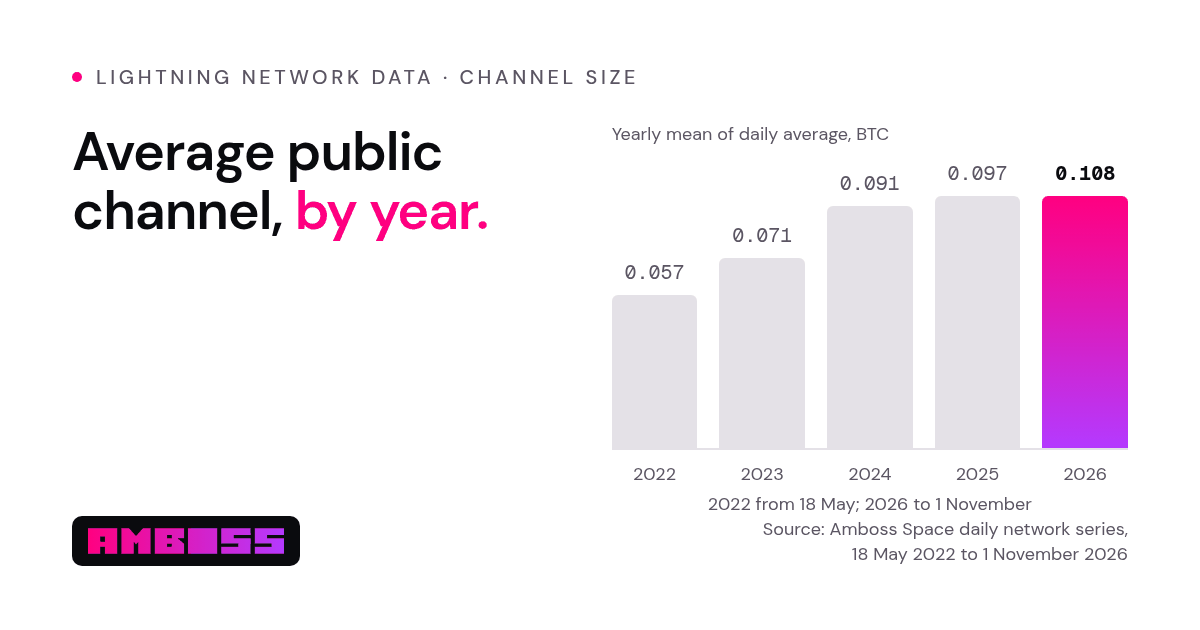
The chart below takes the average public channel on every day of each year and averages it across the year. This smooths out short-term swings.
| Year | Days of data | Average public channel (BTC) |
|---|---|---|
| 2022 (from 18 May) | 228 | 0.057 |
| 2023 | 365 | 0.071 |
| 2024 | 366 | 0.091 |
| 2025 | 365 | 0.097 |
| 2026 (to 1 November) | 305 | 0.108 |
Why channel size matters for payments
A Lightning payment travels through a chain of channels. Each channel can forward at most the liquidity available on its sending side, so the size of the channels along a path sets an upper limit on how much a single payment, or a single part of a split payment, can carry.
Larger channels therefore leave more room for larger payments on each path. For a business, that matters most for the payments that are larger than a typical retail purchase: deposits and withdrawals, supplier and partner payouts, and treasury movements.
Operators are also putting more capital behind each new connection. In October 2026 the average new public channel was 0.45 BTC, the largest monthly figure of 2026. In March 2026 it was 0.28 BTC.
Fewer, larger channels
The network has consolidated as channels have grown. Public channel and node counts are lower than in 2022, and public capacity is below its peak. The table shows the full picture on 1 June of each year and on the latest date.
| Date | Public capacity (BTC) | Public channels | Active nodes | Average channel (BTC) |
|---|---|---|---|---|
| 1 Jun 2022 | 3,955.9 | 82,381 | 16,270 | 0.048 |
| 1 Jun 2023 | 5,521.9 | 76,823 | 17,986 | 0.072 |
| 1 Jun 2024 | 5,020.7 | 56,947 | 16,129 | 0.088 |
| 1 Jun 2025 | 4,430.7 | 46,037 | 14,142 | 0.096 |
| 1 Jun 2026 | 4,913.5 | 45,434 | 15,037 | 0.108 |
| 1 Nov 2026 | 3,246.0 | 33,525 | 13,512 | 0.097 |
Public capacity peaked at 5,869 BTC on 28 December 2025, when the average public channel also reached its highest daily value, 0.127 BTC. Both have come down since. The average channel on 1 November 2026 is still higher than on the same date in 2022, 2023 and 2025, and slightly below the same date in 2024 (0.102 BTC).
Mean and median
The average (mean) public channel is pulled up by a smaller number of very large channels. The median public channel, the one in the middle when all are sorted by size, held 1,500,000 sats (0.015 BTC) in the hourly snapshot of 2 November 2026. A payment path can combine both kinds: large channels between well-funded routing nodes, and smaller channels at the edges where individual users connect.
What the data does not show
- Public channels only. These figures count channels announced to the network. Private channels, and bitcoin held by Lightning services off the public graph, are not included.
- Size is not usage. Channel size describes capacity, not how often that capacity is used. This post makes no claim about payment volume or velocity.
- Averages hide spread. A rising average can come from larger new channels, from small channels closing, or both.
For payments teams
Larger channels on the public network are one reason Lightning can carry payments well beyond small retail amounts. Amboss Payments is a managed service that handles the Lightning side for you, with settlement in seconds to your own wallet and no card chargebacks. Live network data is on Amboss Space. To discuss your payment flows, talk to our team.
Method and sources
- Capacity, public channels and active nodes: Amboss Space daily network series (
getNetworkMetrics.all_time_series, Amboss source), 18 May 2022 to 1 November 2026, fetched 2 November 2026. - Average channel: public capacity divided by public channels, per day. Yearly figures are the mean of the daily values in each calendar year.
- New channels: Amboss Space
channel_series, opens and BTC committed, summed by UTC calendar month. - Median channel: Amboss Space hourly network snapshot (
historical_snapshots), 2 November 2026.