
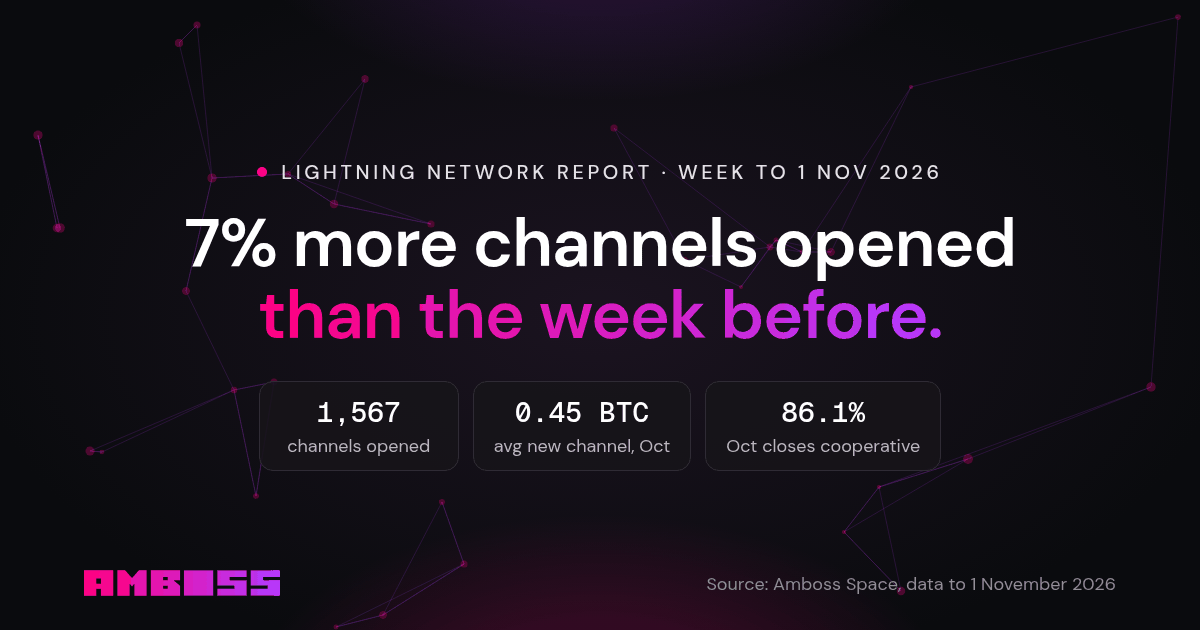
Each week we publish what the public Lightning Network did, using the same data that powers Amboss Space. This is the first report. It covers 26 October to 1 November 2026 and looks back at the month of October.
The week in three numbers
- 1,567 channels opened, 7% more than the 1,461 opened the week before.
- 0.45 BTC average new channel, both this week (0.448 BTC) and across October (0.450 BTC).
- 84.0% of closes were cooperative this week. Across October the share was 86.1%.
Channel activity
Node operators opened 1,567 public channels last week and committed 702 BTC to them. The week before, 1,461 channels were opened with 758 BTC. More channels were opened, and each one was a little smaller on average: 0.448 BTC against 0.519 BTC the week before.
On the other side, 1,925 channels were closed cooperatively and 368 were force-closed. A cooperative close is agreed by both sides and settles in a single on-chain transaction, without the waiting period that a forced close carries.
| 19 to 25 Oct | 26 Oct to 1 Nov | Change | |
|---|---|---|---|
| Channels opened | 1,461 | 1,567 | +7.3% |
| BTC committed to new channels | 758.3 | 702.2 | −7.4% |
| Average new channel (BTC) | 0.519 | 0.448 | −13.7% |
| Cooperative closes | 1,513 | 1,925 | +27.2% |
| Forced closes | 244 | 368 | +50.8% |
| Cooperative share of closes | 86.1% | 84.0% | −2.1 points |
October in context
October was a month of fewer but larger commitments. Operators opened 6,892 channels, fewer than in July (9,441) or August (8,730), and those channels carried 3,102 BTC between them. The average new channel, 0.45 BTC, is the largest monthly figure of 2026. In March it was 0.28 BTC.
Closes were also the cleanest of the year. 86.1% of October's 8,403 closes were cooperative. In every earlier month of 2026 the share was between 80.1% and 83.9%.
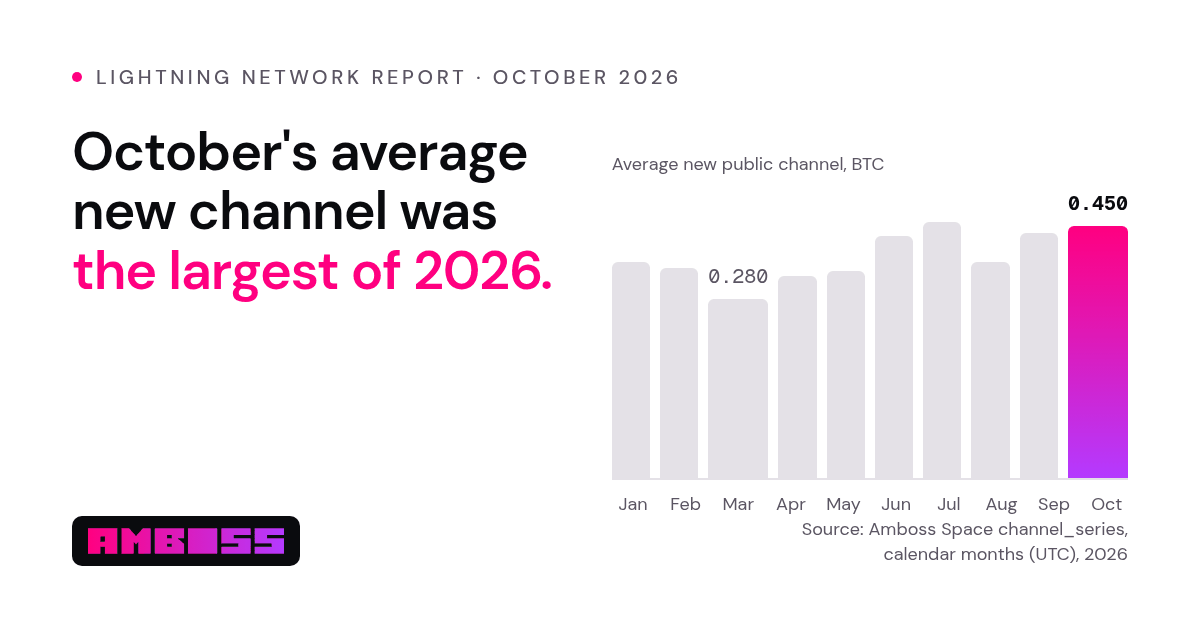
| Month (2026) | Channels opened | BTC opened | Average new channel (BTC) | Cooperative share of closes |
|---|---|---|---|---|
| January | 8,393 | 2,826.6 | 0.337 | 81.4% |
| February | 6,847 | 2,248.4 | 0.328 | 81.3% |
| March | 7,621 | 2,131.6 | 0.280 | 80.9% |
| April | 7,061 | 2,218.2 | 0.314 | 81.8% |
| May | 7,162 | 2,321.5 | 0.324 | 82.8% |
| June | 7,833 | 2,967.6 | 0.379 | 82.8% |
| July | 9,441 | 3,771.4 | 0.400 | 80.1% |
| August | 8,730 | 2,942.1 | 0.337 | 83.9% |
| September | 6,442 | 2,463.0 | 0.382 | 80.7% |
| October | 6,892 | 3,102.1 | 0.450 | 86.1% |
Network size
| 25 Oct 2026 | 1 Nov 2026 | Change | |
|---|---|---|---|
| Public capacity | 3,458.8 BTC | 3,246.0 BTC | −6.2% |
| Public capacity (USD) | $279.5M | $252.2M | −9.8% |
| Public channels | 34,215 | 33,525 | −2.0% |
| Active nodes | 13,562 | 13,512 | −0.4% |
| Average channel | 0.101 BTC | 0.097 BTC | −4.3% |
Public capacity fell over the week and is below its peak of 5,869 BTC on 28 December 2025. Public capacity counts only channels announced to the network. Private channels, and bitcoin held by Lightning services off the public graph, are not included. Over the longer run the average public channel has grown: it held 0.048 BTC in June 2022 and 0.097 BTC on 1 November 2026.
Liquidity market (Magma)
Node operators bought 17.38 BTC of inbound liquidity on Magma in October, up from 10.48 BTC in October 2025. Across all Magma orders to date, the average price has been 4.42% a year. The Lightning Network Rate (LINER) for October was 4.08%.
These are prices paid in the liquidity market. They are not returns from any Amboss product and they are not a forecast.
Fees
The median fee rate across 65,098 public channel policies was 50 parts per million (0.005% of the amount forwarded), with a median base fee of 1 sat, in the snapshot of 2 November 2026. On-chain, the fastest fee estimate was 2 sat/vB. This is network data. Amboss Payments is a managed service, and its pricing is tailored to your volume; it is not the network fee rate.
For payments teams
October's numbers describe operators committing more capital to each new connection than at any point this year, and closing channels by agreement more often than in any earlier month of 2026. If you run payments in a business where cards are expensive or unavailable, Amboss Payments adds Bitcoin and stablecoin payments that settle in seconds to your own wallet, with no card chargebacks. Talk to our team.
Method and sources
- Channel opens and closes: Amboss Space
channel_series, daily, summed over UTC calendar days. Weeks run Monday to Sunday. - Capacity, channels, nodes and USD capacity: Amboss Space daily network series (
all_time_series, Amboss source). - Magma volume and average price, LINER: Amboss Space market metrics (
getAmbossStats.magma_info,getMarketMetrics.volume,lnr_series). - Fees: Amboss Space hourly network snapshot (
historical_snapshots); on-chain fees from the Amboss Space mempool endpoint. - All data fetched from the public Amboss Space API on 2 November 2026. Live charts: amboss.space/stats.